Conflicting Signals
A curated library of case studies examining scenarios where KPIs move in opposite directions, requiring deep analytical rigor to identify the true health of a project or business.
What is Metric Divergence?
In data analysis, conflicting signals occur when two related KPIs move in directions that suggest opposite conclusions. For example, a spike in sales paired with a drop in customer retention indicates that short-term growth may be cannibalizing long-term stability. Our case files explore these paradoxes to help you make balanced, informed decisions.
Divergence Case Library
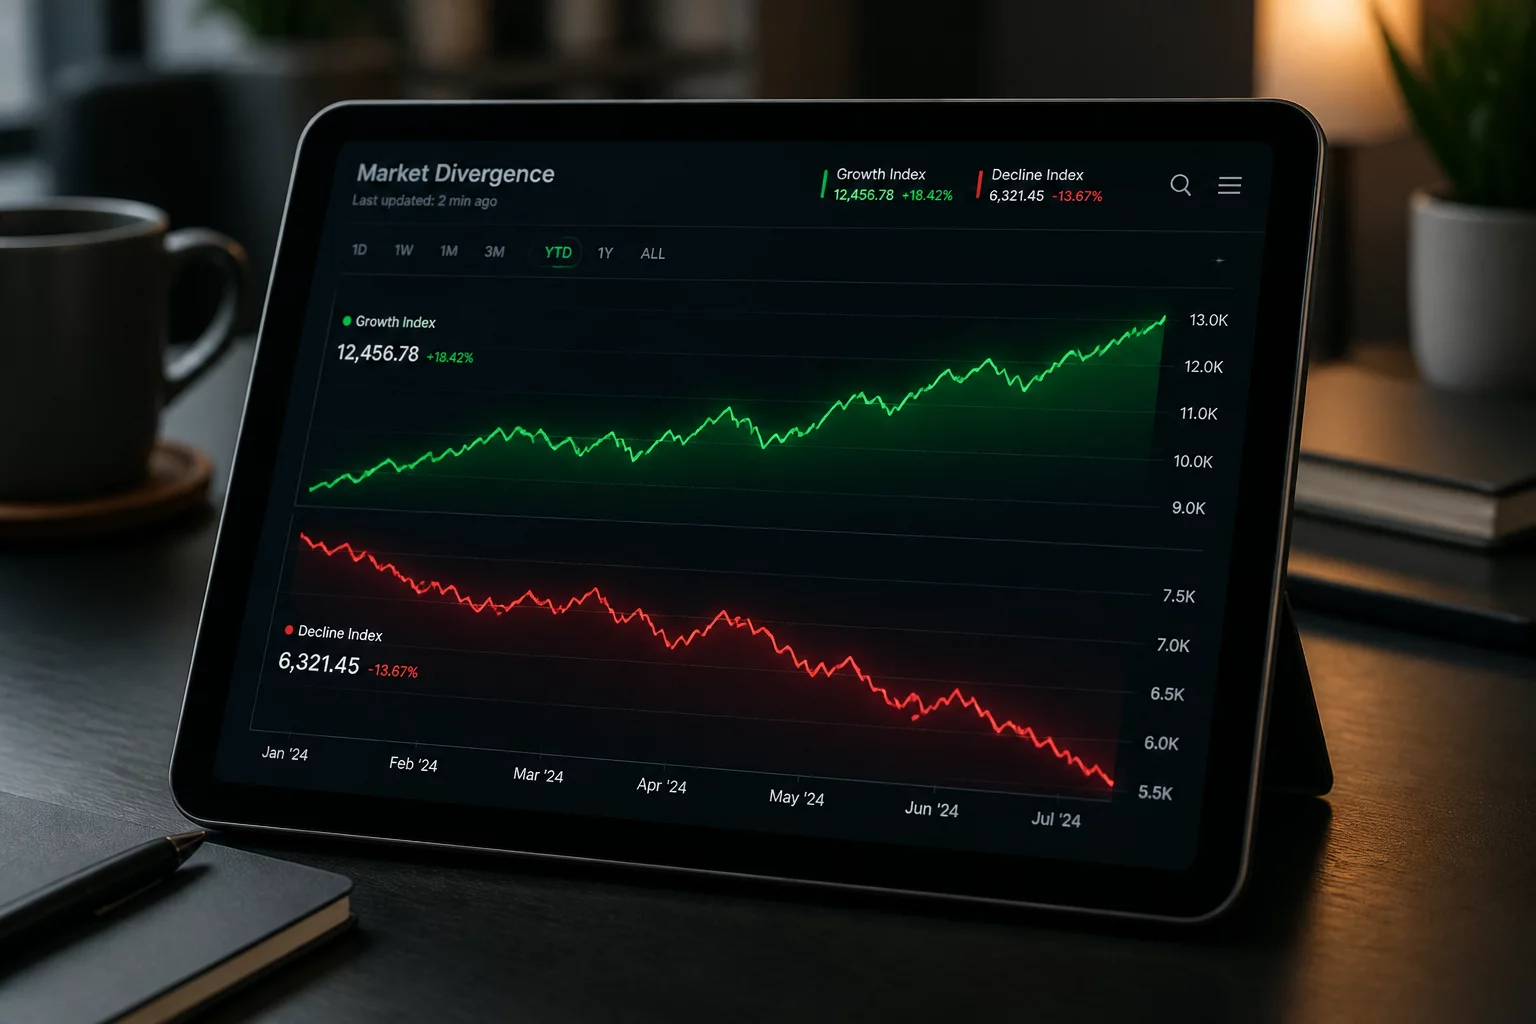
Sales Rose While Retention Fell
An analysis of how aggressive acquisition strategies can lead to a long-term churn crisis despite record-breaking revenue.
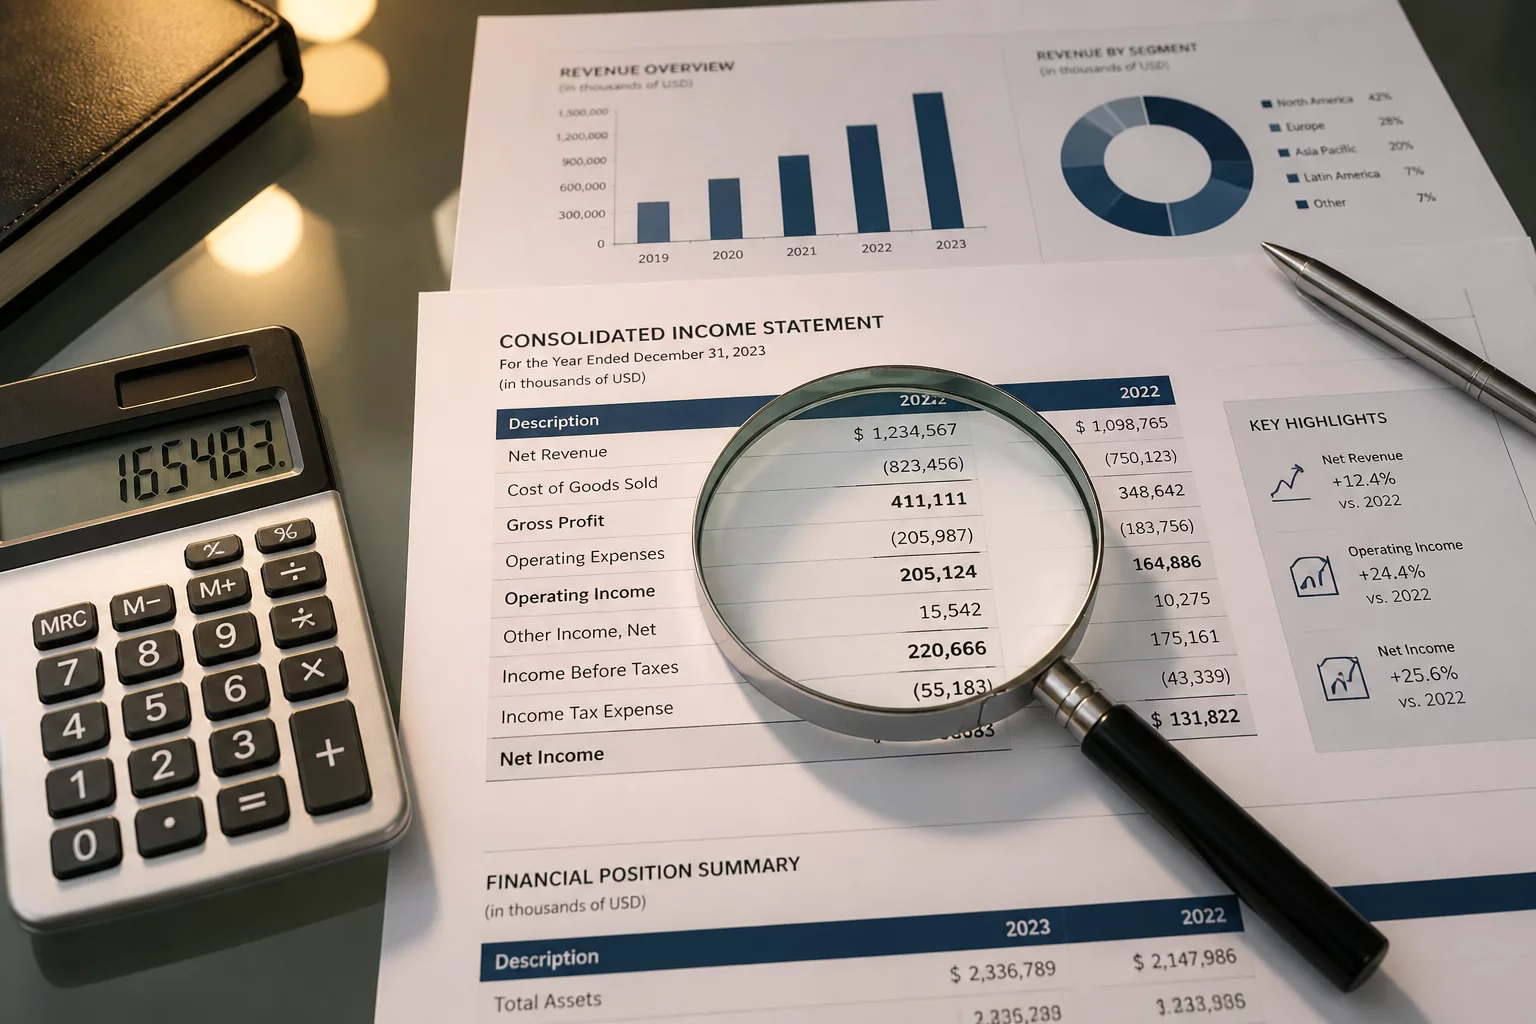
Revenue Up But Margins Down
Decoding the danger of scale when operational inefficiencies begin to outpace top-line revenue growth.

Traffic Spiked But Leads Dropped
When viral marketing attracts the wrong audience, leading to inflated visitor numbers and tanking conversion rates.

Engagement High But Churn Increased
Identifying 'toxic engagement' where users interact frequently but ultimately find no value in the product ecosystem.
No cases found matching your search criteria.